
Bringing Deal Builder metrics into Portal
We’re adding Deal Builder performance metrics into Portal
As we continue to build on and improve the Deal Builder experience, we’re adding Deal Builder Performance metrics into the ‘Analytics to date’ section on your Portal homepage.
By increasing the visibility of Deal Builder Performance metrics, you’ll be able to monitor and measure your performance on Deal Builder. Helping you to identify areas of improvement and see the impact of your changes to increase conversion.
These changes will start to appear in Portal from w/c 1st January 2024.
What will these changes look like?
You’ll now be able to view Deal Builder metrics alongside your other performance, within the same dashboard. This will be demonstrated across two views:
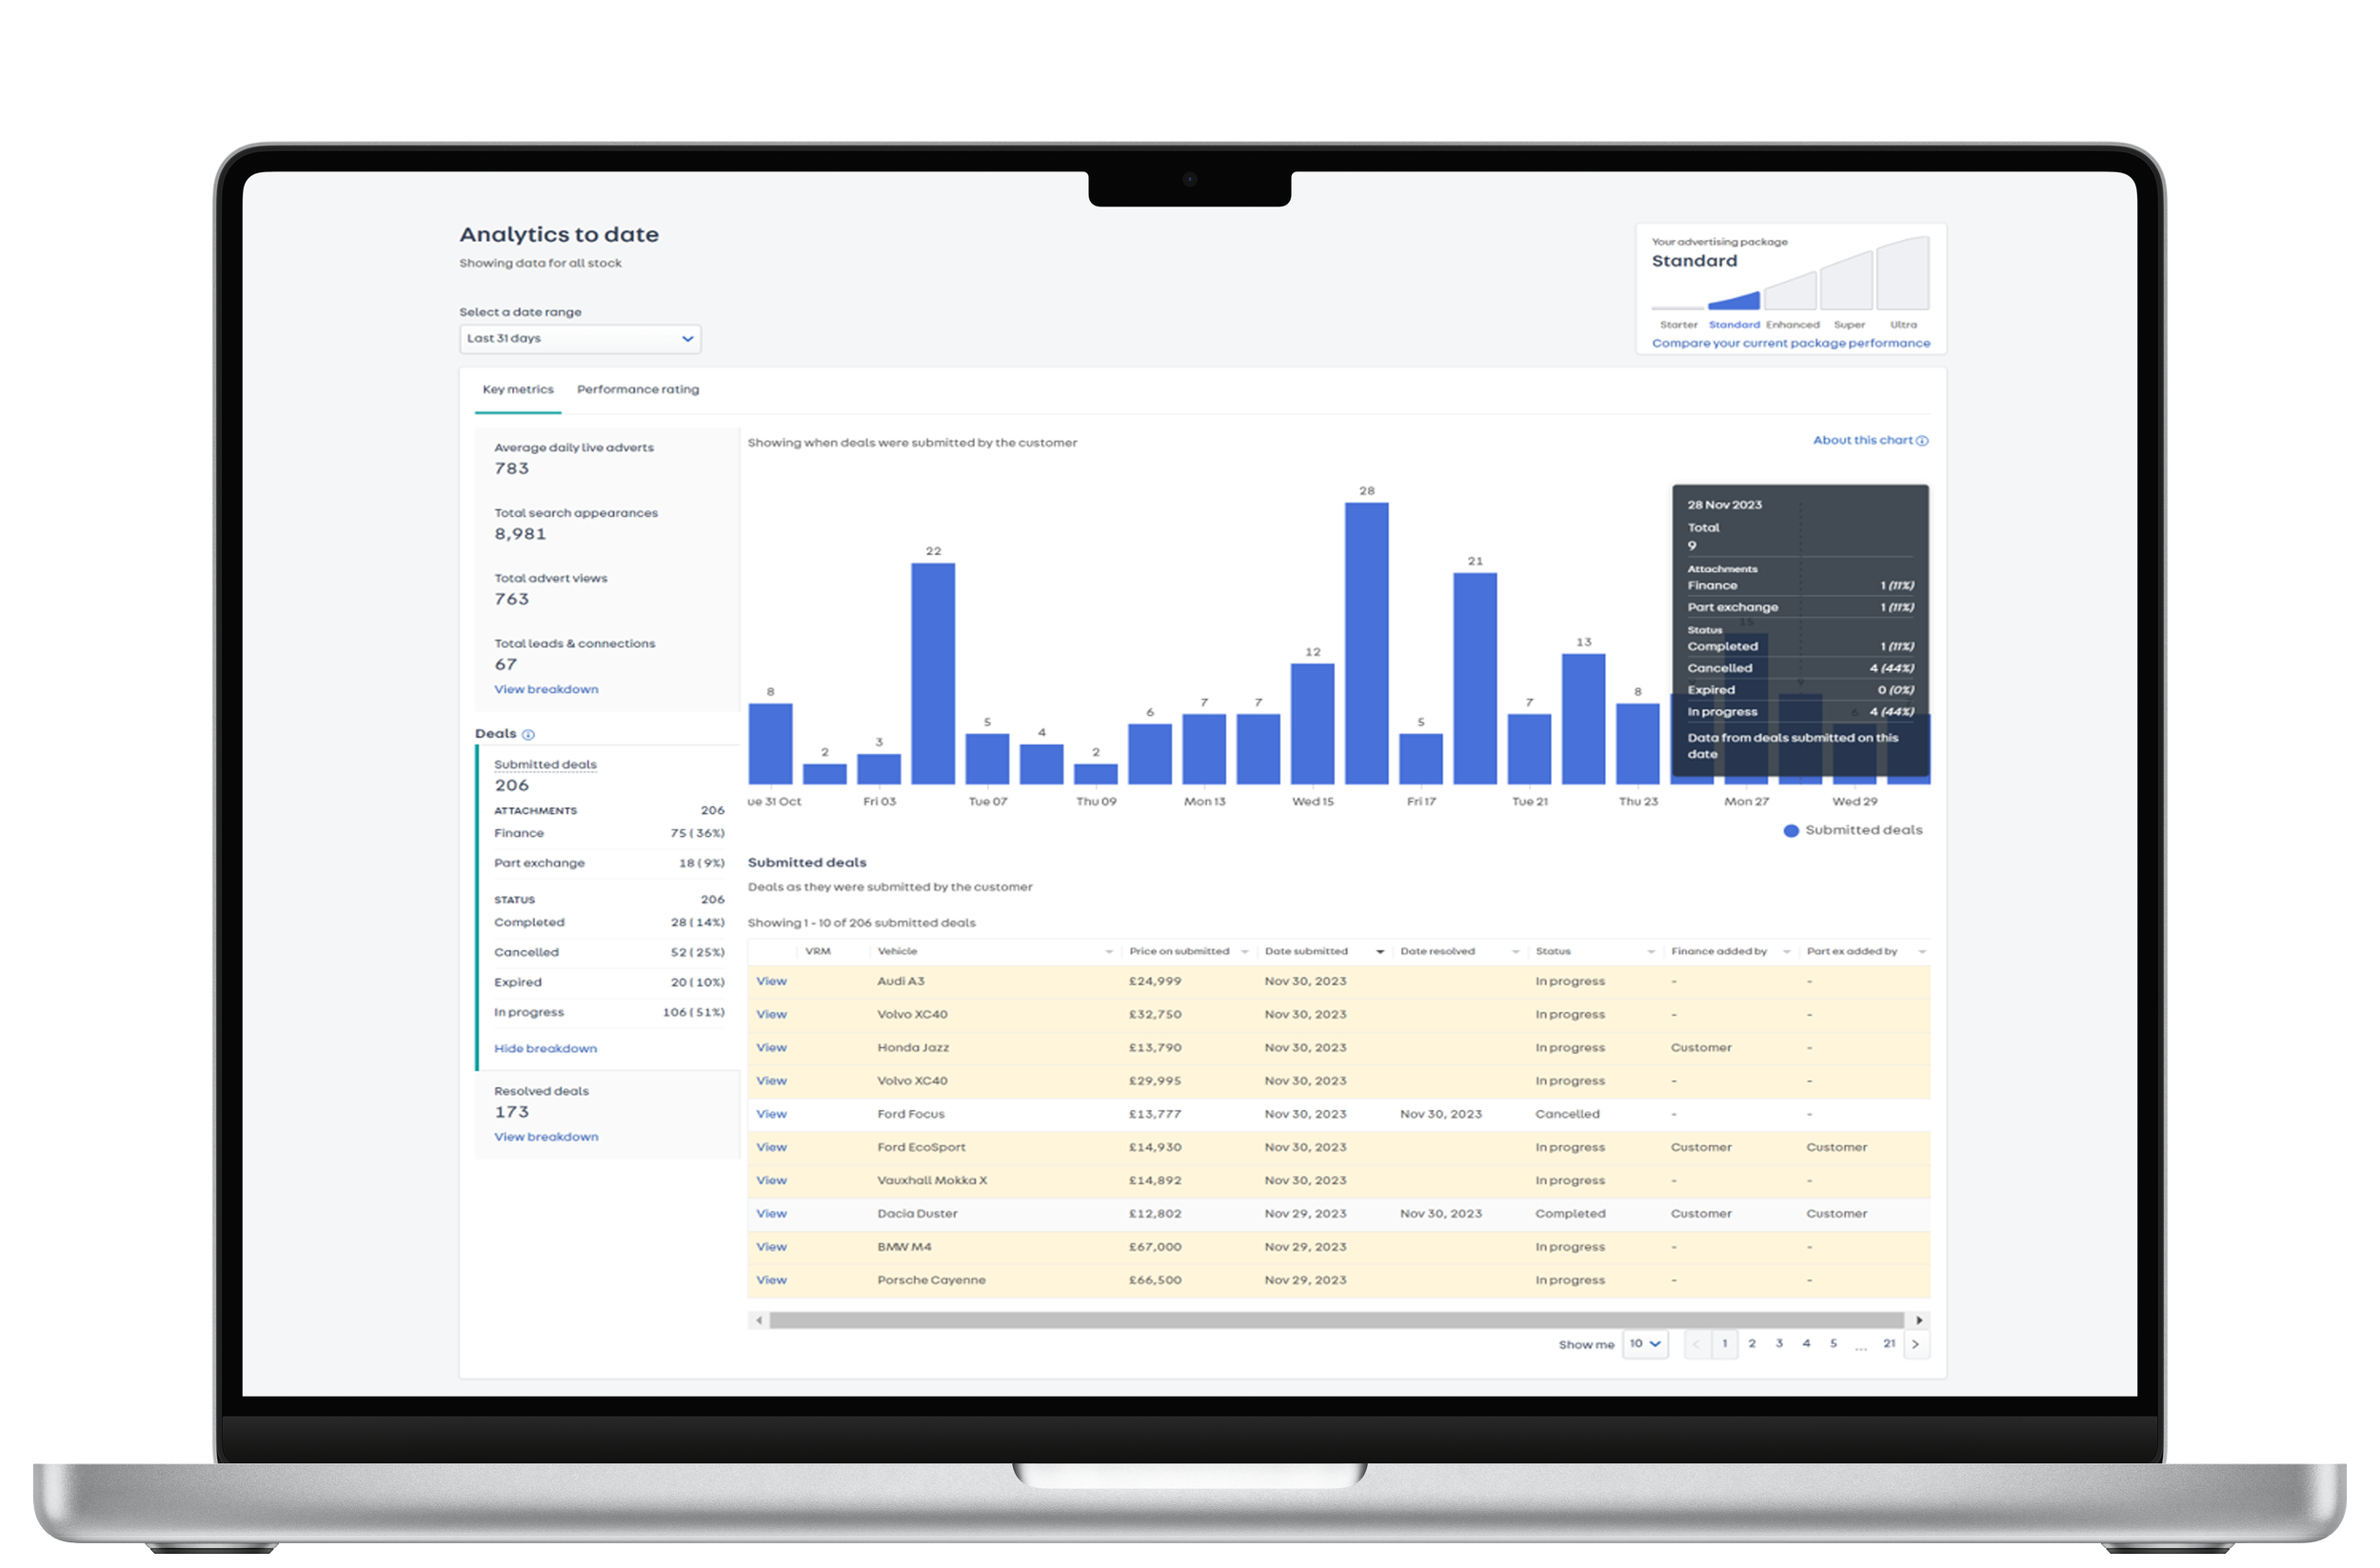
Submitted deals
This is a view of all deals sent to you via Deal Builder over time.
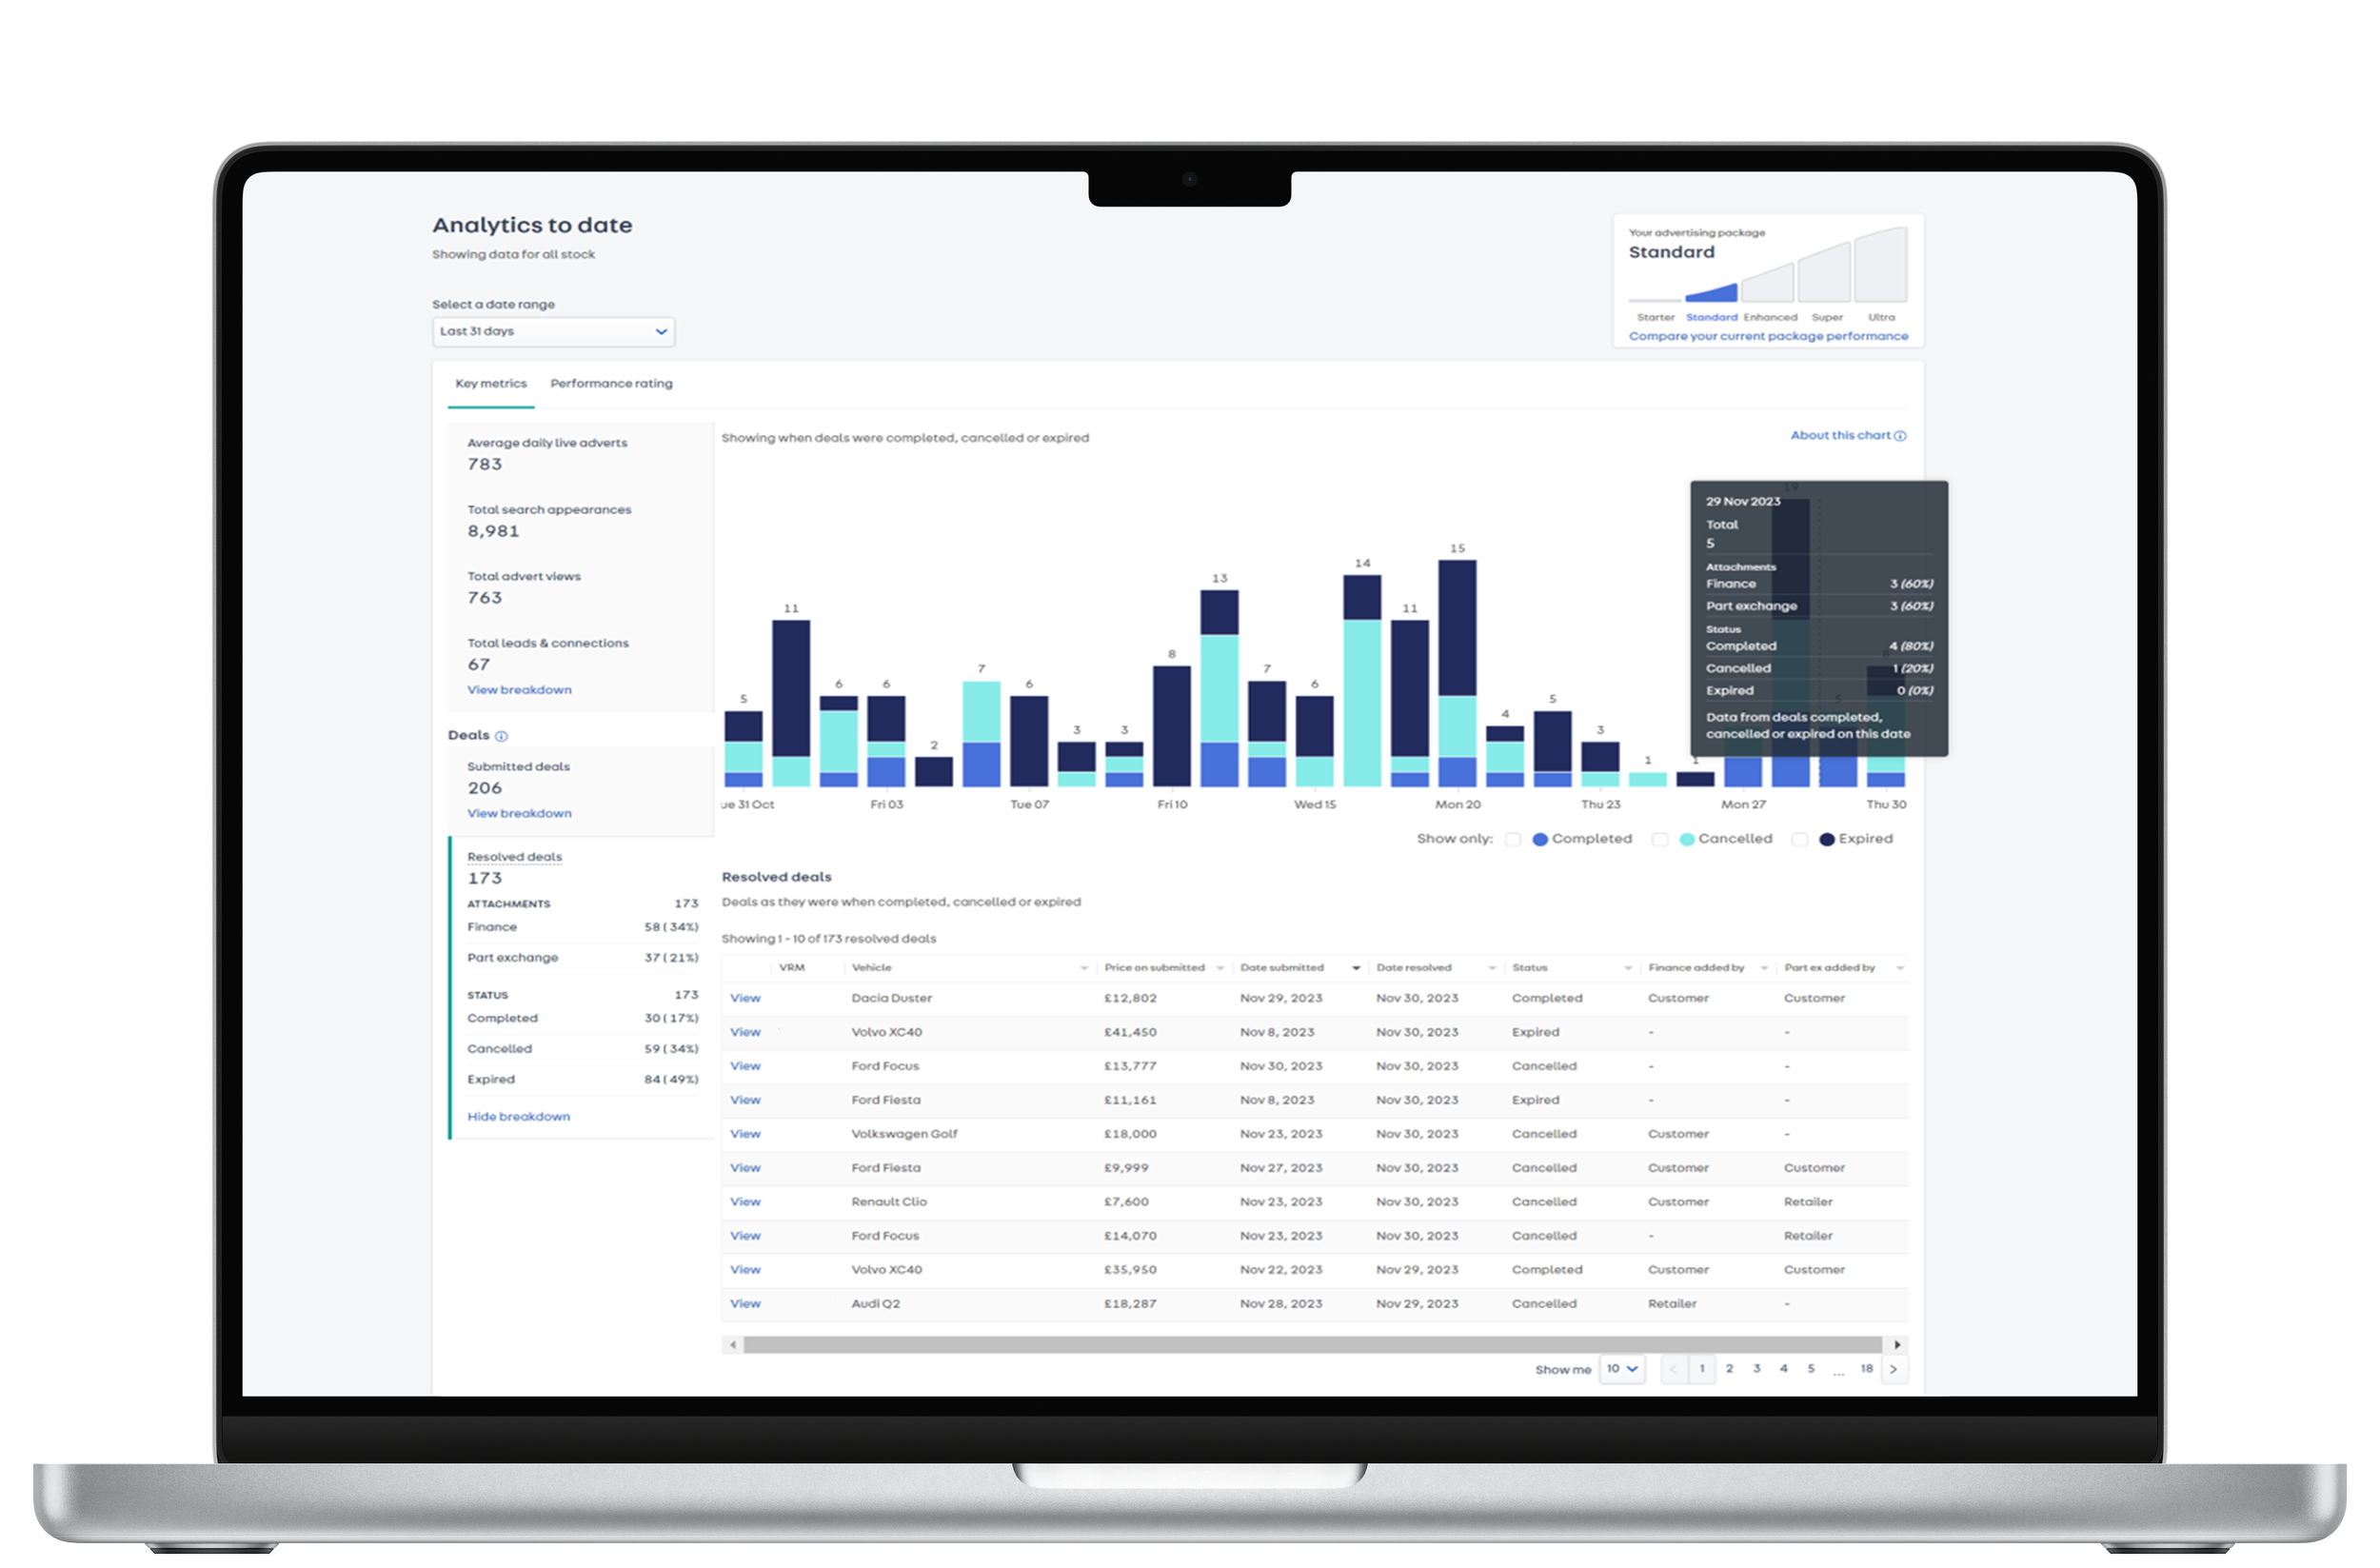
Resolved deals
This is a view of all concluded deals, split by status over time.
Alongside these two new views, we are also introducing several new features that will provide even more insight into your Deal Builder performance

Historic Deal Builder metrics
Deals analytics will be available over the default “Last 31 Days”, plus the other usual date ranges in Portal, allowing you to monitor your performance over time.

Deals Breakdown
Get a breakdown of both submitted and concluded deals , split by attachment, deal status and conversions.
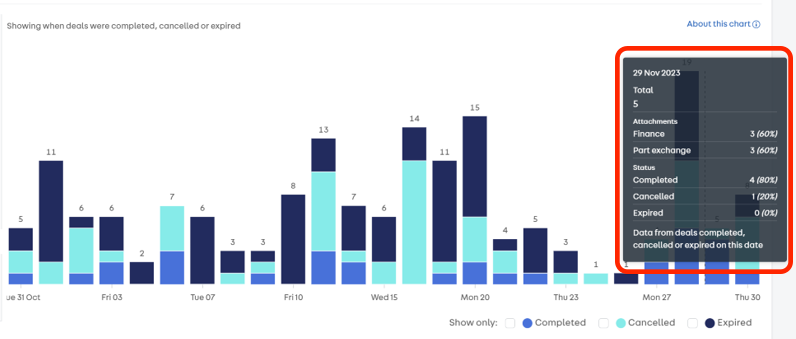
Graph view
Similar to how other performance metrics are displayed in Portal today, all deals received can be viewed over time across both the Submitted deals and Resolved deals views. The outcome and breakdown of the deals can be viewed when hovering over the chosen date.
We are always striving to develop Deal Builder and improve your experience. If you have any feedback or concerns, please reach out to your Account Manager.